By correlating historical and preliminary data I attempt to provide perspective on the 2020 Covid-19 pandemic in various countries. At this moment I am only able to analyze countries with highly efficient statistical infrastructures. The numbers are preliminary, but of high confidence intervals; they are subject to change but are not expected to do so radically. If you find any errors, I appreciate if you let me know.
“Mortality rate” in this article is defined as the percentage of the population that dies in a given period (m = deaths * 100 / population.)
Norway

- In Norway, the average mortality rate from 2000-2019 was 0.86%.
- In 2020 the preliminary mortality rate is 0.74%, which is well below their long term average.
- 0.74% is the lowest mortality rate in the recorded history of Norway.
- There are no reports of overloaded hospitals.
- Norway has had light lockdown measures and no mask mandates.
- Fiscal measures in response to Covid-19 in Norway amount to 5.3% of it’s GDP (NOK245.4 billion.)
https://www.ssb.no/statbank/table/07459/
https://www.ssb.no/statbank/table/07995/
https://www.regjeringen.no/en/topics/the-economy/economic-policy/economic-measures-in-norway-in-response-to-covid-19/id2703484/
Sweden


- In Sweden, the average mortality rate from 2000-2019 was 0.97%.
- In 2020 the preliminary mortality rate is 0.94%, which is slightly below their long term average.
- The previous year Sweden experienced a higher mortality rate was in 2012 (0.96%.)
- There are no reports of overloaded hospitals.
- Sweden has had no lockdown measures and no mask mandates.
https://www.statistikdatabasen.scb.se/pxweb/sv/ssd/START__BE__BE0101__BE0101A/BefolkningR1860/
https://www.statistikdatabasen.scb.se/pxweb/sv/ssd/START__BE__BE0101__BE0101G/ManadFoddDod/
https://www.scb.se/hitta-statistik/statistik-efter-amne/befolkning/befolkningens-sammansattning/befolkningsstatistik/pong/tabell-och-diagram/preliminar-statistik-over-doda/
Germany

- In Germany, the average mortality rate from 2000-2019 was 1.06%.
- In 2020 the preliminary mortality rate is 1.16%, which is above their long term average.
- The 2020 mortality rate is 0.01 more than in 2018 (1.16% vs. 1.15%.)
- The mortality rate in Germany appears to closely follow a long-term upwards trend.
- There are no reports of overloaded hospitals.
- Germany has had somewhat repressive lockdown measures and mask mandates.
- Fiscal measures in response to Covid-19 in Germany amount to 39.9% of it’s GDP (€1367.5 billion.)
https://www-genesis.destatis.de/genesis/online?operation=themes&levelindex=0&levelid=1611455508071&code=12#abreadcrumb
https://www.destatis.de/EN/Press/2021/01/PE21_032_12621.html
New Zealand

- On New Zealand, the average mortality rate from 2000-2019 was 0.68%.
- In 2020 the preliminary mortality rate is 0.64%, which is slightly below their long term average.
- New Zealand has had a statistically insignificant amount of Covid-19 cases.
- New Zealand has had light lockdown measures and light mask mandates.
https://www.stats.govt.nz/topics/population
https://www.stats.govt.nz/experimental/covid-19-data-portal?tab=Health&category=Weekly%20deaths
United Kingdom

- In the United Kingdom, the average mortality from 2000-2019 was 0.94%.
- In 2020 the preliminary mortality rate is 1.02%, which is slightly above their long term average.
- The mortality rate in 2020 is lower than in 2000 and 2003, and the same as in 2001.
- The 2020 mortality rate in the UK is lower than the long term average in Germany.
- There are no reports of overloaded hospitals.
- The UK has had extremely repressive lockdown measures and mask mandates.
- Fiscal measures in response to Covid-19 in the UK amount to 25.7% of it’s GDP (£568.1 billion.)
https://www.ons.gov.uk/peoplepopulationandcommunity/populationandmigration/populationestimates/timeseries/ukpop/pop
https://www.ons.gov.uk/peoplepopulationandcommunity/birthsdeathsandmarriages/deaths/datasets/deathsregisteredinenglandandwalesseriesdrreferencetables
https://www.ons.gov.uk/peoplepopulationandcommunity/birthsdeathsandmarriages/deaths/datasets/deathregistrationssummarytablesenglandandwalesdeathsbysingleyearofagetables
https://www.ons.gov.uk/peoplepopulationandcommunity/birthsdeathsandmarriages/deaths/datasets/weeklyprovisionalfiguresondeathsregisteredinenglandandwales
https://www.nisra.gov.uk/publications/weekly-deaths
https://www.nrscotland.gov.uk/statistics-and-data/statistics/statistics-by-theme/vital-events/general-publications/weekly-and-monthly-data-on-births-and-deaths-registered-in-scotland
Israel
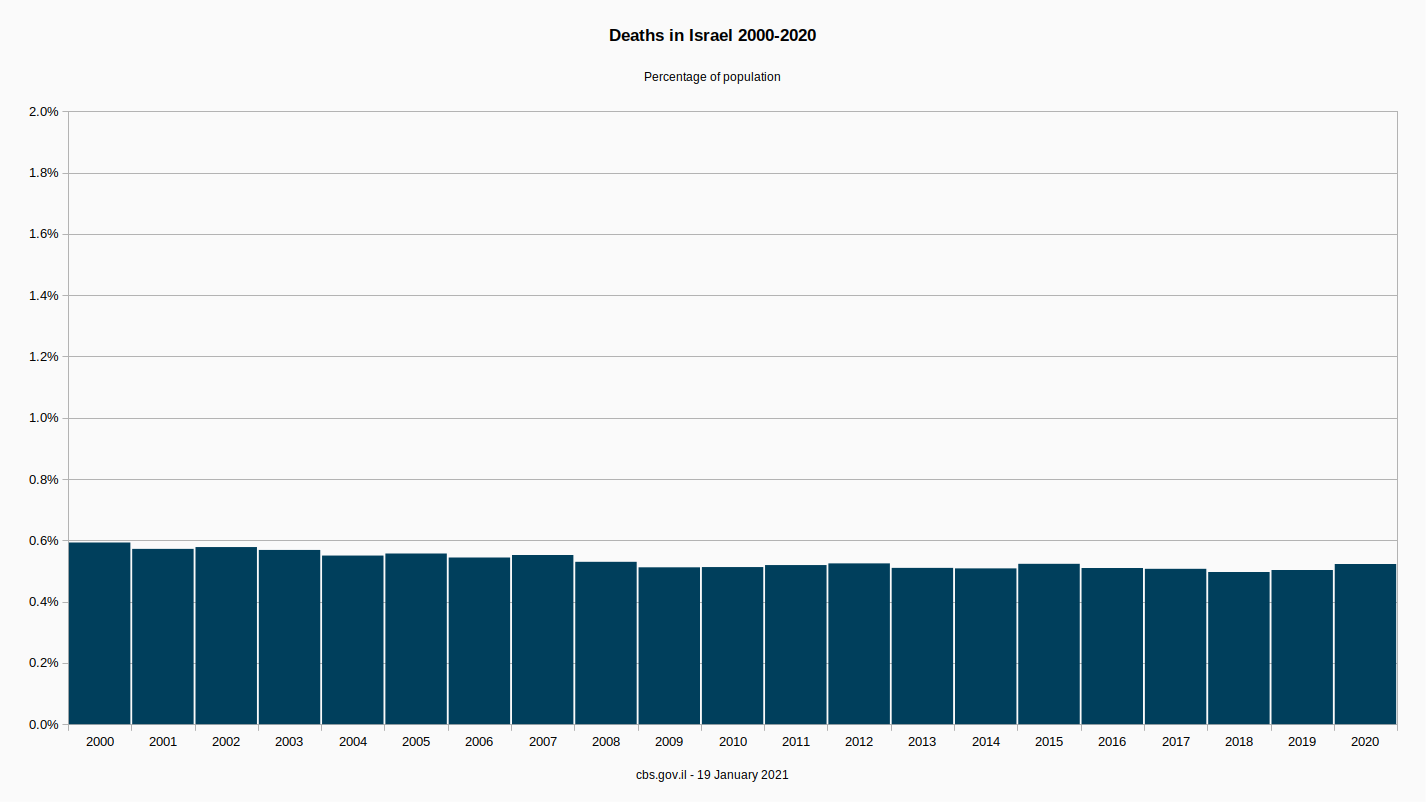
- In Israel, the average mortality rate from 2000-2019 was 0.53%.
- In 2020 the preliminary mortality rate is 0.52%, which is marginally below their long term average.
- There are no reports of overloaded hospitals.
- Israel has had somewhat repressive lockdown measures and mask mandates.
https://www.cbs.gov.il/en/Statistics/Pages/Generators/Time-Series-DataBank.aspx?level_1=2
https://www.cbs.gov.il/he/publications/LochutTlushim/2020/%D7%A4%D7%98%D7%99%D7%A8%D7%95%D7%AA-%D7%A9%D7%A0%D7%94-%D7%97%D7%95%D7%93%D7%A9.xlsx
France

- In France, the average mortality rate from 2000-2019 was 0.87%.
- In 2020 the preliminary mortality rate is 0.99%, which is above their long term average.
- The mortality rate in 2020 is 0.08 more than the one in 2019 (0.99% vs. 0.91%,) which is the same difference there was between 2003 and 2004.
- The French average mortality rate in the 1950s, 60s, 70s and 80s was higher than in 2020.
- There are no reports of overloaded hospitals.
- France has had extremely repressive lockdown measures and mask mandates.
- Fiscal measures in response to Covid-19 in France amount to 28% of it’s GDP (€676 billion.)
https://www.insee.fr/en/statistiques/fichier/4493808/2021-01-22_deces_sexe_age_lieu.zip
https://www.insee.fr/en/statistiques/4493808?sommaire=4493845
https://www.insee.fr/en/statistiques/serie/001641586
https://www.insee.fr/en/statistiques/serie/001641603
https://www.macrotrends.net/countries/FRA/france/death-rate
United States


- In the US, the average mortality rate from 2000-2019 was 0.83%.
- In 2020 the preliminary mortality rate is 0.99%, which is well above their long term average.
- There appears to be a statistically significant excess mortality in the US in 2020 according to CDC numbers.
- In 2020 the mortality rate is 0.12 more than in 2019 (0.99% vs. 0.87%.)
- The 2020 mortality rate in the US is lower than the long term average in Germany.
- The 2020 mortality rate in the US is the same as the long term average in Denmark.
- The 2020 mortality rate in the US is the same as the 2008 mortality rate in Sweden.
- There are reports of overloaded hospitals in some places.
- The US has had extremely repressive lockdown measures and mask mandates in some places.
- Fiscal measures in response to Covid-19 in the US amount to 14.3% of it’s GDP ($3061 billion.)
https://wonder.cdc.gov/controller/datarequest/D76
https://www.cdc.gov/nchs/nvss/vsrr/COVID19/
https://www.cdc.gov/nchs/data/dvs/lead1900_98.pdf
Estonia

- In Estonia, the average mortality rate from 2000-2019 was 1.23%.
- In 2020 the preliminary mortality rate is 1.18%, which is slightly below their long term average.
- The mortality rate in Estonia appears to follow a downwards trend, but is higher than most western countries.
- There are no reports of overloaded hospitals.
- Estonia has had light lockdown measures and light mask mandates (from Dec. 2020.)
https://andmed.stat.ee/en/stat/rahvastik__rahvastikusundmused__surmad/RV04/table/tableViewLayout1
https://andmed.stat.ee/en/stat/rahvastik__rahvastikusundmused__surmad/RV45/table/tableViewLayout1
https://andmed.stat.ee/en/stat/rahvastik__rahvastikunaitajad-ja-koosseis__rahvaarv-ja-rahvastiku-koosseis/RV021/table/tableViewLayout1
Netherlands

- In the Netherlands, the average mortality rate from 2000-2019 was 0.85%.
- In 2020 the preliminary mortality rate is 0.96%, which is above their long term average.
- The 2020 mortality rate is 0.07 more than in 2018 (0.96% vs. 0.89%.)
- There are a few reports of overloaded hospitals.
- The Netherlands has had extremely repressive lockdown measures and light mask mandates (from Dec. 2020.)
- Fiscal measures in response to Covid-19 in the Netherlands amount to 15% of it’s GDP (€120.3 billion.)
https://www.cbs.nl/en-gb/news/2021/01/week-52-mortality-further-up-among-long-term-care-users
https://opendata.cbs.nl/statline/#/CBS/en/dataset/03743eng/table?ts=1611818753353
https://opendata.cbs.nl/statline/#/CBS/en/dataset/7233ENG/table?ts=1611818879726
Denmark

- In Denmark, the average mortality rate from 2000-2019 was 0.99%.
- In 2020 the preliminary mortality rate is 0.95%, which is below their long term average.
- The previous year Denmark experienced a higher mortality rate was in 2018.
- There are no reports of overloaded hospitals.
- Denmark has had somewhat repressive lockdowns and mask mandates.
- Fiscal measures in response to Covid-19 in Denmark amount to 16.8% of it’s GDP (DKK387.4 billion.)
https://www.statbank.dk/DODC2
https://www.statbank.dk/statbank5a/SelectVarVal/Define.asp?Maintable=FOLK2&PLanguage=1
https://www.statbank.dk/statbank5a/SelectVarVal/Define.asp?Maintable=DOD&PLanguage=1
Finland

- In Finland, the average mortality rate from 2000-2019 was 0.94%.
- In 2020 the preliminary mortality rate is 1.01%, which is slightly above their long term average.
- The 2020 mortality rate is 0.03 more than in 2019 (0.98%.)
- There are no reports of overloaded hospitals.
- Finland has had light lockdown measures and no mask mandates.
https://pxnet2.stat.fi/PXWeb/pxweb/en/StatFin/StatFin__vrm__vaerak/statfin_vaerak_pxt_11ra.px/
https://pxnet2.stat.fi/PXWeb/pxweb/en/StatFin/StatFin__vrm__kuol/statfin_kuol_pxt_12af.px/
https://pxnet2.stat.fi/PXWeb/pxweb/en/Kokeelliset_tilastot/Kokeelliset_tilastot__vamuu_koke/koeti_vamuu_pxt_12ng.px/
https://pxnet2.stat.fi/PXWeb/pxweb/en/StatFin/StatFin__vrm__vamuu/statfin_vamuu_pxt_11lk.px/
Japan

- In Japan, the average mortality rate from 2000-2019 was 0.92%.
- In 2020 the preliminary mortality rate is 1.10%, closely following an upwards trend.
- The 2020 mortality rate is 0.01 more than in 2019 (1.09%.)
- The 2020 mortality rate in Japan is the same as the 2016 mortality rate in Germany.
- There are no reports of overloaded hospitals.
- Japan has had no lockdown measures and no mask mandates.
- Fiscal measures in response to Covid-19 in Japan amount to 44% of it’s GDP (JPY234.2 trillion)
https://dashboard.e-stat.go.jp/en/timeSeriesResult?indicatorCode=0203020000000010000
https://dashboard.e-stat.go.jp/en/timeSeriesResult?indicatorCode=0201010000000010000
https://www.japantimes.co.jp/news/2021/02/23/national/coronavirus-japan-deaths-2020/
https://home.kpmg/xx/en/home/insights/2020/04/japan-government-and-institution-measures-in-response-to-covid.html
Other sources and data
https://www.bruegel.org/publications/datasets/covid-national-dataset/


great stuff
LikeLike
From the US comments: “In 2020 the mortality rate is 0.1% higher than in 2019.” is incorrect. It’s closer to a 12% increase, though it is 0.1 higher. You made a similar math error in the comments for Germany and perhaps for other countries as well I didn’t look.
Otherwise this is a good undertaking and shows us actual valuable data for deciding whether or not the crippling of economies and lives was worth it. A breakdown of death by age group would also be useful. As would by cause of death, but as long at they continue to incorrectly attribute up to 93% of deaths to Covid-19 those nbrs are useless.
LikeLike
Thanks! I’ve changed the wording to reflect this nuance.
LikeLike
“In 2020 the mortality rate is 0.1% above the one in 2019.” sorry but this is the same issue.
2019 to 2020 the mortality rate goes from .87% to .99% which is an increase of 0.12 percentage points (which I assume you rounded to 0.1). But in terms of percentage it is a 13.7% increase. Correct wording would be “In 2020 the mortality rate is 13.7% higher than in 2019”.
I wanted to say thanks for compiling all of the data, This is important information any time but especially now. Using your data I did a comparison of 2016-19 vs. 2020 for the 10 countries with complete data. The mortality rate went from about 0.93% over 2016-19 to 1.01% in 2020, which is a significant increase, I think. Clearly the death rate is up but why?, is the question we need to answer now.
LikeLike
Instead of averages you should use linear regression. Maybe one long term for the whole date set and one short term for the last 5-10 years (ending with 2019) and compare 2020 with the regression lines. That would be more accurate than the simple averages since the data is trending in most cases.
LikeLike
The problem with regression is that it requires an ad hoc assumption about the existence of a linear trend, and therefore makes the conclusions harder to interpret. In contrast, statements like “2020 mortality rate is smaller than in 2018,” accompanied by a plot of the historical data, is about as clear of a distillation of “truth” from statistical data as is possible. Great job, OP!
LikeLike
Awesome, thanks for doing this.
LikeLike
Thanks, re-blogged here : https://cv19.fr/2021/01/23/taux-de-mortalite-en-france-et-dans-le-monde/
If you could find data for Brazil, Japan, Russia and China it would be great but it’s kind of hard to get.
LikeLike
Good work – I have done similar, and discovered that the percentage of population all-cause mortality rate in England & Wales 1945 to 1985 consistently averaged 1.16%………C-19 has made barely an impact.
This is especially true when we realise that UK’s population of over-65s has increased by 13% in the past 20yrs, and that over-100s constitute nearly 1% of the population……..these people have to die at some point.
Population mortality averaged 0.89% in the 2010s…….combine this with the aging population, and we will undoubtedly see percentage of population mortality increase in the 2020s.
LikeLike
The maths here is wildly flawed. The difference between two small percentages is not a percentage difference. Let me try to explain:
The difference between 10 fish and 15 fish is 5 fish
But it is not an increase of 5%.
5 fish is 50% of 10 fish
So the difference between 10 fish and 15 fish is 50%
The difference between 10 apples and 15 apples is 5 apples
But it is not an increase of 5%.
5 apples is 50% of 10 apples
So the difference between 10 apples and 15 apples is 50%
The difference between 10% and 15% is 5%
But it is not an increase of 5%.
5% is 50% of 10%
So the difference between 10% and 15% is 50%
Taking the UK % death figures mentioned above, and basing on a UK pollution of 66 million
We expect 0.94% of the population to die. That would be 0.6392 million dead
In 2020 1.02 of the population died. That would be 0.6636 million dead
So that’s an extra 0.0544 million dead
Take away the “million” abbreviation and that equates to an extra 54,400 deaths above the average. Which is a lot.
Or to put it another way,
0.0544 mill (the excess) is an increase of 9%
(9% of 0.6392mill is 0.544 mil)
So UK deaths are up 9% last year
LikeLike
While you are not wrong, oronu isn’t wrong either. The mortality rate is clearly 0.08% higher than last year, but it increased by 9%. These are different, and both correct, observations. It means an additional 0.08% of the total population died this year compared to last year, or 9% more people died this year than died last year.
The naive conclusion could be that corona deaths make up that increase, so 8% of all deaths in 2020 (yes not 9%).
Considering influenza and pneumonia deaths in the UK made up about 15000 deaths per year, this year would have the equivalent of 3 years of influenza/pneumonia deaths in excess mortality. Nothing to scoff at, but not a national emergency either.
LikeLike
Here from pol, thanks for this data, nice n concise
LikeLike
It would be nice to also see age in the comparison. And maybe for 10 gears Also most populations live longer now compared to 20 gears ago.
But very nice comparison!
LikeLike